

The $902 Billion Fantasy
What Fulton County's Reparations Report Teaches Us About Reading Numbers; Or: why every civics classroom in America should be studying this document, just not for the reasons its authors intended.

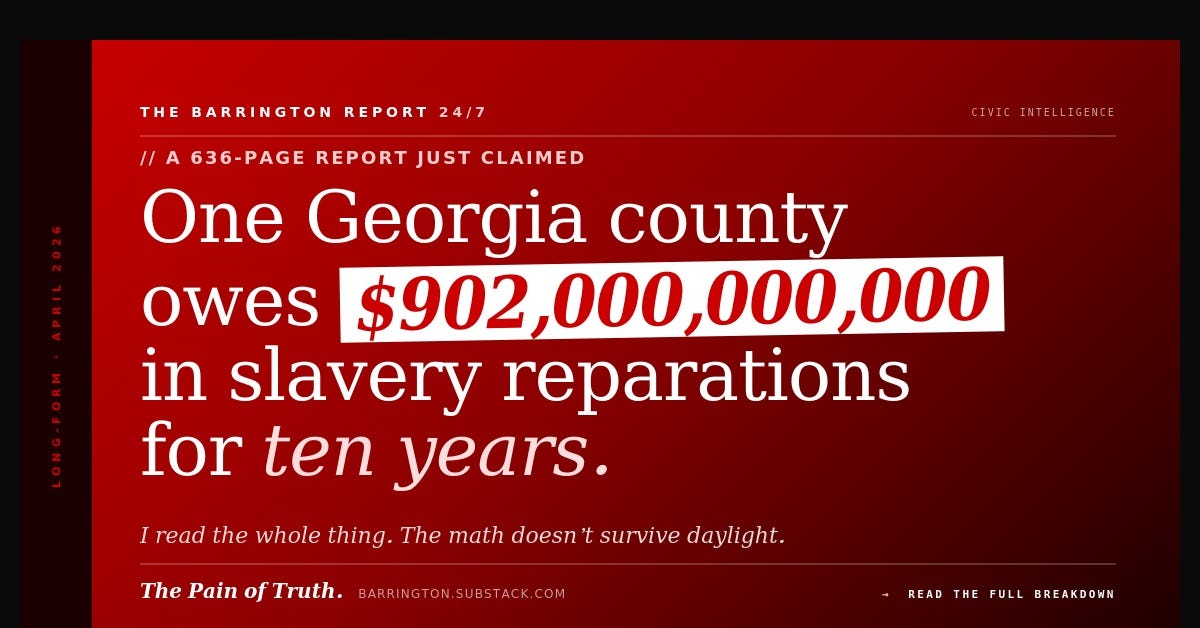
On November 19, 2025, the Fulton County Reparations Task Force adopted a 636-page Harm Report. The document represents years of work, a team of credentialed researchers, and a Board of Commissioners vote that made national news. It is being positioned as a model for other jurisdictions to follow.
I read it.
The history is real. The math is not. The gap between those two things is one of the most important civic lessons available to us in 2026.
This piece is going to do two things at once. First, it is going to walk you through exactly what the report claims, how it got there, and why the numbers collapse under any serious scrutiny. Second, and more importantly, it is going to use that walkthrough to teach something that almost nobody is teaching in American schools right now: how to read a quantitative claim without getting rolled.
Most Americans, regardless of political tribe, cannot distinguish between a number that came from rigorous analysis and a number that came from a pre-determined conclusion dressed up in a spreadsheet. That is not a partisan failure. That is a civic failure. It is happening across every major policy debate we have, from housing to climate to reparations to immigration to AI.
The Fulton County report just happens to be an unusually clean specimen.
The Category Error At The Heart Of The Report
Before examining the report’s methodology, a deeper problem has to be named, because it is the problem that makes the methodology problem possible. The Fulton County Harm Report does not just make bad math. It makes a category error about what kind of claim it is making.
Historical narratives and quantitative calculations are different types of claims. A historical narrative is an interpretation, built from primary sources and arranged into a framework that makes meaning out of events. Narratives are contested by definition, because different historians reading the same sources can arrange them into different frameworks. This is not a weakness of historical work. It is the nature of the enterprise. History is argument about meaning, conducted under the discipline of evidence.
A quantitative calculation is something different. A calculation takes measured inputs, applies defined operations, and produces a numerical output. The output is supposed to be reproducible. Any competent analyst working from the same inputs and using the same operations should arrive at the same result. That reproducibility is what gives numbers their authority. It is why a dollar figure in a report feels more solid than a paragraph of historical interpretation, even when the dollar figure is built on shakier ground.
The Fulton County report fuses these two types of claims in a way that lets the interpretive weight of the historical narrative borrow the apparent solidity of the quantitative output, without earning it. The narrative underneath the math is presented as settled fact. The math on top of the narrative is presented as objective calculation. Neither presentation is honest.
Consider what the report actually does. It takes a historical interpretation, specifically, that American chattel slavery is the dominant causal explanation for the present-day economic condition of Black Americans in Fulton County, and it treats that interpretation as a settled input rather than as a contested argument. It then applies quantitative operations, including compound interest, wage extrapolation, and inflation adjustment, to generate an output figure. The output looks like a measurement. It is actually a narrative multiplied by a spreadsheet.
The number does not prove the narrative. The narrative is smuggled in as an assumption, the number is calculated from the assumption, and then the number is presented as if it vindicates the assumption it was built from.
This matters regardless of what you think about the underlying historical questions. A reader can hold any number of positions on American history, on the causes of the Civil War, on the trajectory of Reconstruction, on the relative weight of slavery versus Jim Crow versus redlining versus contemporary policy, and still recognize that building a $902 billion damages figure on top of any contested historical interpretation is the same category error. That is circular reasoning dressed up in the clothes of quantitative analysis.
The appropriate intellectual move, whenever you encounter a report like this, is to separate the two claims and evaluate them independently. What is the historical narrative being asserted? What is the evidence for it? Is that evidence contested, and if so, by whom? Separately, what are the quantitative operations being performed? Are those operations mathematically valid? Do the assumptions they rely on survive scrutiny? Only after both questions have been answered independently can you assess whether the final number means anything at all.
The Fulton County report fails on both levels. The historical narrative it assumes is one interpretation among several that credentialed historians hold about the relationship between slavery and present-day outcomes. It is not a settled matter. It is an active debate within the discipline. Orlando Patterson, Thomas Sowell, Glenn Loury, John McWhorter, Henry Louis Gates Jr., Annette Gordon-Reed, Edward Baptist, and many others have published serious scholarly work reaching different conclusions about the causal chain from 1865 to the present. Treating one position in that debate as a settled input, without argument, is a failure of intellectual honesty.
The quantitative operations performed on top of that unsettled narrative then fail on their own terms, independently. The wage assumptions are unrealistic. The compound interest rates are fantastical. The counterfactual paths are double-counted. The sensitivity ranges span three orders of magnitude. We will walk through those failures in detail in the next sections.
The point worth holding onto, before we get into the math, is this: adopting a historical narrative as the foundation of a claim that cannot truly be quantified, and then presenting the quantitative output as if it proves the narrative, is one of the most common and most corrosive patterns in contemporary policy analysis. It happens across every political direction. It happens in climate reports that assume specific emissions trajectories, in drug war analyses that assume specific behavioral responses, in immigration studies that assume specific integration patterns, in reparations calculations that assume specific causal chains. Every time it happens, the narrative is doing the argumentative work while the math is doing the credibility work, and the reader is being asked to accept the combination as if it were a single, solid thing.
It is not a single, solid thing. It is two separate claims, stacked on top of each other, each propping up the other. Pull either one out and the whole structure falls.
That is what we are going to do with the Fulton County report now. First we will examine what the rhetorical device actually produced. Then we will stress-test the math on its own terms. Then we will ask what an honest version of this analysis would look like if the narrative and the quantification were kept properly separated.
What the Report Actually Claims
The headline claim of Chapter 1, the opening substantive chapter, written by the Task Force Chair herself, is that Fulton County, Georgia owes somewhere in the range of hundreds of billions of dollars for ten years of slavery-era labor extraction. The specific figure, calculated at a 7% annual compounding rate over 171 years, is $902,466,751,559.
Nine hundred and two billion dollars. For one county. For one decade, 1854 to 1864.
The report’s other quantified damages, scattered across twenty-one chapters, follow the same pattern. The Gartrell inheritance case, involving thirty named enslaved people, is valued at $4.5 billion in foreclosed wealth. Chattahoochee Brick Company’s convict labor exploitation is valued at $13.6 billion. Ad valorem tax revenue collected on enslaved people as property compounds to $4.7 billion at the county level and $8.2 billion at the state level. The chain gang labor across Fulton County over a century tallies to $1.78 billion. The report does not provide a grand total, however summing the high-end estimates across chapters yields a figure that exceeds a trillion dollars owed by one Georgia county.
For context: Fulton County’s entire annual budget is roughly $1.4 billion. The claim is that one county owes more than seven hundred years of its total spending. The state of Georgia’s entire annual GDP is around $800 billion. The claim is that one decade of enslaved labor in one county generated a compounded debt exceeding the state’s entire annual economic output today.
If your instinct is that something has gone wrong in the arithmetic, that instinct is correct. The specific nature of what went wrong is worth understanding, because the same technique is being used in reparations reports across the country, including California’s 2023 task force, San Francisco’s committee recommendations, and Evanston’s housing program, and across unrelated policy domains as well.
The Math Trick, Explained
Here is how the $902 billion number is constructed. Pay attention, because this is the key move.
The researchers start with a reasonable-sounding question: what would enslaved people have earned if they had been paid white manual laborers’ wages? They cite legitimate economic historians, including Stanley Lebergott, Robert Margo, and the Historical Statistics of the United States, to establish a wage baseline. So far, so good.
Next they multiply that wage by an assumed work schedule: fourteen hours per day, 365 days per year. Every day. No Sundays. No Christmas. No illness. No childbirth. No weather disruption. No seasonal slowdown in agricultural labor. Just 5,110 hours per year of continuous extraction, applied uniformly to every adult and even to children counted on tax rolls.
For comparison, the report acknowledges in the same table that white manual laborers worked 3,432 hours per year, sixty-six hours per week, fifty-two weeks. The model therefore assumes enslaved people worked nearly fifty percent more hours than the free laborers whose wages are being used as the comparison benchmark.
This is historically false. Every serious historian of American slavery, from Fogel and Engerman to Eugene Genovese to Herbert Gutman, documents that enslaved people generally had Sundays off, reduced Saturday labor, and seasonal variation in agricultural work. The 14-hour, 365-day assumption is not conservative. It is not even realistic. It is the theoretical physical maximum, chosen because it produces the largest possible base number.
That gets you to $8.96 million in aggregate unpaid wages for 1854-1864.
Then comes the real trick.
The report takes each year’s labor figure and compounds it forward at 7% annually to 2025. Compound 1854’s $432,487 at 7% for 171 years and you get $45.7 billion. Compound 1855’s figure and you get $46.7 billion. Compound 1856’s and you get $45.6 billion. Stack up all eleven years and you arrive at the headline number: $902 billion.
A 7% annual return for 171 years is a roughly 114,000% increase, a 1,140x multiplier. Every 1854 dollar becomes $1,140 in 2025.
No losses. No interruptions. No taxes. No transaction costs. No market crashes. No wars. No depressions.
For this to be a realistic counterfactual, the following would all have to be true simultaneously.
That formerly enslaved people, legally barred from owning property, banking wealth, or inheriting under state law, would have achieved top-quartile-of-the-S&P-500 returns uninterrupted from 1854 through 2025.
That their descendants would have maintained those returns through Reconstruction, the Panic of 1873, the Panic of 1893, the collapse of the Freedmen’s Savings Bank, which wiped out actual documented Black savings, Jim Crow, the Great Depression, two World Wars, 1970s stagflation, the dot-com crash, and the 2008 financial crisis.
That none of the wealth would have been spent. Not on food. Not on housing. Not on education for children. Not on medical care. For 171 years.
That the tax code, which has averaged roughly 25-40% effective drag on investment returns across the period, simply did not exist.
That is not a damages calculation. That is a fantasy.
The report labels this the conservative range because it also shows a 3% and 5% version. However 3% produces $1.3 billion, 5% produces $34 billion, and 7% produces $902 billion. When your model’s output spans three orders of magnitude based purely on which interest rate you pick, the interest rate is not a conservative assumption. It is the lever that determines the conclusion.
The Double-Count Nobody Mentions
There is a second problem that makes the bad math worse. The report calculates multiple counterfactuals in parallel and treats them as if they are additive.
Chapter 1 compounds the ad valorem taxes collected on enslaved people as property and gets $4.7 billion at the county level. Next it separately compounds the unpaid labor of those same enslaved people and gets $902 billion. The same human beings, appearing on the same tax rolls, generate two separate streams of damages, the taxes paid on their bodies as property, and the wages not paid for their work, and both are carried forward to 2025 without any reconciliation between them.
Chapter 4, on the Gartrell case, does the same thing at the individual level. For the thirty people named in Francis Gideon’s will, the report separately compounds:
• The unpaid inheritance ($4.5 billion at 7%)
• The unpaid railroad dividends from the same estate ($16.7 billion at 7%)
• The unpaid wages of those same enslaved people ($93 billion at 7%)
• The foreclosed land investment those inheritances could have funded ($96 million)
These are not independent damages. The inheritance was partly constituted by the extracted labor. The railroad shares were part of the inheritance. The land they could have bought would have been purchased with 10% of the same inheritance that is also separately compounding. The report sums them as if they are parallel harms, however in any real counterfactual history the thirty enslaved people would have lived one life and accumulated wealth along one path. You cannot collect maximum damages for every theoretical path they could have taken. The universe does not branch that way.
The Chattahoochee Brick chapter adds a third layer of error: it applies CPI inflation adjustment (factor of 33.9) AND compound interest at 2.5% to the same base figure. That is charging twice for the time value of money, once through inflation and once through interest, when standard damages math picks one or the other. That is not a theoretical quibble. It is a textbook error that any undergraduate economics student should catch in a first-semester course.
The Part That’s Actually Good
Here is where I have to be honest, because scorched-earth criticism without acknowledgment of what works is just tribalism.
The archival research in this report is real. Karcheik Sims-Alvarado, the Task Force Chair and principal researcher, has done legitimate primary-source historical work. Fulton County wills. Tax digests from 1854 through 1864. The actual case record of American Colonization Society v. Gartrell (1857). Census rolls. Microfilm collections from Lincoln County, Clarke County, and Fulton County. She names specific enslavers, specific enslaved people, specific estates, and specific court rulings.
The story of Francis Gideon’s 1853 will, which attempted to free thirty enslaved people and bequeath them substantial inheritances contingent on their relocation to Liberia, and the subsequent legal battle in which Gideon’s son-in-law Lucius Gartrell used Georgia’s anti-manumission statutes to overturn the will and keep the people enslaved, that is a genuinely important piece of Fulton County legal history. It deserves to be documented. It deserves to be taught.
The chain gang camp inventories, the convict lease holder records, the county-by-county mapping of where enslaved labor was extracted and where its profits accumulated, all of that is useful historical record-keeping.
If you stripped out the quantification chapters and published the remaining historical scholarship as a county history monograph, it would be a credible contribution to the literature. The problem is not the history. The problem is what happens when advocacy-driven damages math gets welded to real archival work, because the result is a document that looks rigorous from a distance and falls apart on inspection.
That is the civic education problem in a nutshell.
How to Read a Quantitative Claim Without Getting Rolled
This is the part that matters beyond Fulton County. The technique used in this report is used everywhere, in every political direction, on every major issue. Here is a checklist I would give to any ninth-grade civics student, or any adult who reads the news, before they accept a big scary number as real.
Question one: What is the base figure, and how was it measured?
Before anything else, find the raw number the calculation starts from. In the Fulton County report, the base is $8.96 million in stolen wages for 1854-1864. Everything else is that number multiplied by assumptions. If the base is built on absurd inputs, like 14-hour workdays for 365 days a year, the rest does not matter. Bad inputs produce bad outputs no matter how sophisticated the math downstream looks.
This applies to every claim. When someone tells you a program will save $X billion over ten years, or cost $X billion, or create $X billion in economic activity, the first question is always what the year-one base is and how it was measured. Almost every inflated policy claim is built on a quietly inflated base.
Question two: What is the compounding or extrapolation rate, and who chose it?
Long time horizons hide large lies. When somebody projects a number over 20, 50, or 171 years, the annual growth rate becomes the entire ballgame. A 3% rate over 171 years produces a 165x multiplier. A 7% rate produces a 1,140x multiplier. Same starting number, result differs by almost 7x.
When you see a long-range projection, ask two things: what rate are they using, and why that rate? In the Fulton County report, 7% is the S&P 500’s historical nominal return with reinvested dividends, before taxes, before fees, before any life event. That is a theoretical ceiling, not a realistic assumption for anyone’s actual wealth trajectory, and certainly not for people who were legally barred from owning property.
You will see the same pattern in climate cost projections, Social Security solvency models, education ROI arguments, and infrastructure benefit-cost analyses. The assumed rate of growth, or decay, almost always determines the conclusion. Almost nobody reports the sensitivity of their result to that assumption.
Question three: Is the same thing being counted more than once?
When a report lists multiple damages, ask whether they are truly independent or whether they share underlying quantities. In the Fulton County report, the ad valorem tax compounding and the stolen labor compounding are partially double-counting because they both derive from the same tax digest records. The Gartrell case chapter compounds inheritance, dividends, wages, and land appreciation as four separate damages when they are all variations on the same underlying wealth stream.
This pattern is everywhere in policy analysis. Stimulus multiplier effects get added to direct spending benefits. Health care savings get claimed by four different programs simultaneously. Infrastructure projects get credited with every indirect benefit their consultants can think of, with no adjustment for overlap.
The test is simple: if you could somehow go back and experience only one of the counterfactual paths, would you still be entitled to all the damages? If not, it is a double-count.
Question four: Are the downside scenarios modeled at all?
The Fulton County report models only upward growth. No market crashes. No bank failures. No wealth dilution across generations. The thirty original Gideon beneficiaries have thousands of descendants today, and the report never addresses who the rightful recipient would be. No taxes. No transaction costs. No spending. The counterfactual is a straight line up for 171 years.
Any honest damages calculation has to model what would realistically have happened, including the failures. The Freedmen’s Savings Bank collapse of 1874 alone wiped out approximately $3 million in Black depositor savings, which in today’s dollars is somewhere between $80 million and $1 billion depending on whose compounding you use. That is a documented loss to actual formerly enslaved people that the report’s counterfactual simply pretends did not happen.
Whenever you see a projection that only goes one direction, the analyst has already decided what they want the answer to be.
Question five: What is the sensitivity range?
A good analysis shows you how the answer changes when you vary the inputs. The Fulton County report technically does this, showing 3%, 5%, and 7%, however it then quotes the 7% number in the summary paragraph, which is the advocacy move. The sensitivity analysis reveals that the answer ranges from $1.3 billion to $902 billion depending on which rate you pick. A serious analyst would say: our confidence interval spans three orders of magnitude, therefore we cannot credibly claim a point estimate. An advocate says: the headline number is $902 billion.
When you see a confidence interval that spans orders of magnitude, the point estimate is not reliable. Full stop.
It does not matter how credentialed the authors are or how many citations are in the footnotes.
Question six: Who benefits from the number being large, and what editorial discipline did the authors impose on themselves?
This is the integrity question. Every analyst has incentives. The question is whether they have acknowledged those incentives and built in discipline against them. A reparations task force has obvious incentives to produce a large number. A Chamber of Commerce has obvious incentives to produce a large economic-benefit-of-policy-X number. A defense contractor has obvious incentives to produce a large cost-of-not-funding-Y number.
The question is not whether bias exists. It always does. The question is whether the analysis shows evidence of self-correction, of stated methodology that constrains the authors’ ability to move the number in their preferred direction. In the Fulton County report, the conservative framing gets applied to assumptions that are anything but conservative. That is a tell.
Why This Matters For Civic Education
We do not teach this in schools. I know because I teach ninth-grade American Government, and I have read the state standards. Students learn the three branches of government, the Bill of Rights, and how a bill becomes a law. They do not learn how to read a budget projection. They do not learn how to spot a double-count. They do not learn that a 7% compounding assumption over 171 years is the difference between a credible claim and a fantasy.
This is the foundational weakness of American civic participation in 2026. The problem is not that citizens are uninformed. Everyone has access to more information than any generation in human history. The weakness is that citizens cannot evaluate the quantitative claims embedded in the information they are flooded with. In a policy environment where almost every argument now comes attached to a dollar figure, the inability to read those figures critically is the inability to participate as an informed citizen at all.
The Fulton County Reparations Harm Report is going to be cited. It already is. It will show up in policy debates in other jurisdictions. It will appear in journalistic coverage. The billion-dollar figures will get quoted without the methodology being examined, because examining methodology is boring and the numbers are dramatic. That is how modern policy laundering works. A credential-weighted document produces a number, the number gets cited, the citation gets treated as evidence, and six news cycles later the number has hardened into a factoid that nobody bothers to verify.
This is why civic education has to evolve. The three branches of government have not changed since 1789. The information environment has changed beyond recognition in the last twenty years. A civics curriculum that does not teach quantitative literacy, not statistics, not advanced math, but the basic skill of asking where did this number come from and what happens if I stress its assumptions, is preparing students for a country that no longer exists.
A Final Word On What This Report Actually Does
I want to close with something that needs to be said plainly, because the scorched-earth methodological critique above only addresses the math. The deeper problem with this report is the pattern it represents, a pattern that shows up across the policy landscape regardless of which political direction is producing the claim.
Slavery happened in Fulton County. The people Francis Gideon tried to free and Lucius Gartrell kept enslaved were real people with names, children, and grandchildren. The chain gang system was real. The convict lease system was real. The racial tax disparities of the post-Reconstruction era were real.
The report’s problem is not the history it documents. The report’s problem is that it smuggles a contested historical interpretation into the foundation of a quantitative calculation, presents the output of that calculation as if it were a measurement, and then uses the apparent solidity of the measurement to retroactively validate the interpretation that was smuggled in. That is a circular structure dressed up as an analytical one, and it would be the same error regardless of whose politics it served.
Imagine a Chamber of Commerce report that assumed as a settled premise that regulation is the dominant causal factor suppressing small business formation, applied a compounding model across decades to project forgone economic output, and arrived at a figure in the hundreds of billions of dollars of regulatory damages. The historical narrative underneath would be contested. The math on top would borrow the narrative’s authority while pretending to be independent of it. The final number would appear to validate the narrative it was built from. That is the same error in a different political direction, and it would deserve the same critique.
The discipline this demands is uncomfortable. It requires separating what you believe about history from what can actually be calculated. It requires accepting that some harms are real and consequential but not quantifiable in dollar terms to the precision of nine hundred and two billion. It requires acknowledging that the strength of a historical argument does not transfer to the strength of a numerical estimate built on top of it. A compelling narrative about injustice does not produce a reliable damages calculation. A reliable damages calculation requires inputs, assumptions, and operations that can survive independent scrutiny, and the Fulton County report’s inputs, assumptions, and operations cannot.
The descendants of the enslaved people this report names deserve better than the document produced in their name. They deserve scholarship that treats them as agents rather than as units of economic extraction. They deserve policy analysis that addresses current, measurable barriers with current, measurable interventions. They deserve quantification that could survive economic peer review rather than crumbling under a first-year graduate student’s examination.
They also deserve a civic conversation that refuses to let narratives and numbers masquerade as each other. Producing a $902 billion figure for one county over one decade does not advance the cause of serious reparations discussion. It discredits it. Every time one of these figures gets published and then falls apart under inspection, it becomes harder for the next researcher, possibly a more careful one, to get a hearing. The fantasy math is not just bad scholarship. It is a disservice to the very people the report is supposedly for.
That is the final civic lesson here. Bad quantification does not just mislead readers. It corrodes the credibility of legitimate claims that share the same subject matter. When advocates choose big-scary-number tactics over defensible methodology, they make the work harder for everyone who comes after them. When narrative arguments get laundered through spreadsheets into numerical conclusions, the numerical conclusions will not survive first contact with serious scrutiny, and the original narrative will be weakened along with them.
THE VERDICT
Read the numbers. Stress the assumptions. Check the compounding. Ask whether the same thing is being counted twice. Separate the historical narrative from the quantitative operation and evaluate each on its own terms. Teach your kids to do the same. The alternative is a country where policy is determined by whoever can manufacture the most dramatic figure, and the citizens who are supposed to be checking that work never learned how.
STAY CONNECTED
Subscribe: barrington.substack.com
Follow: @TBR24_7 on X
Listen Live: ATL Talks Radio • Atlanta’s #1 Streaming Talk Radio
The Pain of Truth.
One calculation I would like to see, is if reparations of this magnitude were paid out to every black person in the US, how much a cheeseburger would set you back?
When someone claims that a single county owes $900 billion in reparations, debunking it doesn't require careful analysis. It's like someone claiming their climate model has found the average temperature in that county is 5,000 degrees -- a figure so utterly, stupidly inflated that a single glance at reality is enough to blow it out of the water.